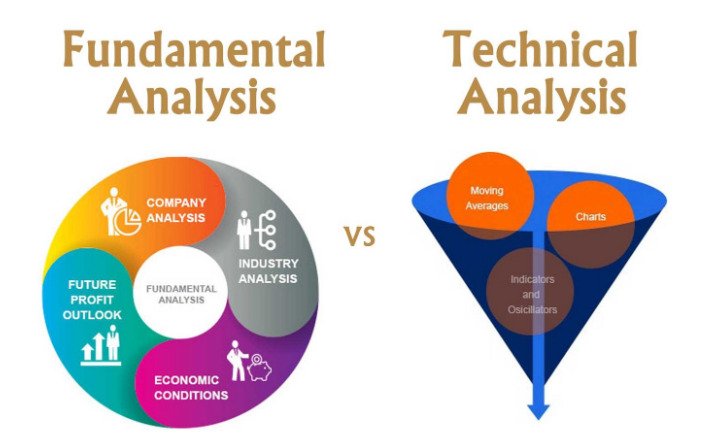
fundamental analysis VS technical analysis:
| COMPARISON FACTOR | FUNDAMENTAL ANALYSIS | TECHNICAL ANALYSIS |
| Definition and Objective | Analysis of securities to determine the intrinsic value of the stock and identify if it is overvalued or undervalued. | Uses charts and technical tools to identify historical patterns and trends to determine the future price of the stock and the right time to enter or exit the market. |
| Investment Horizon | Long term investments | Short term investments |
| Ideal For | Investing and trading for long-term positions | Investing and trading for long-term positions |
| Takes Into Account | Past and present data | Historical data only |
| Data Sources | Publicly available annual reports, news publications, and industry statistics | Past performance metrics plotted on charts and other statistical tools |
| Factors Considered | Macroeconomic factors, general economic indicators, industry benchmarks, and the company’s performance and growth prospects | Prices, time period, transactional volume, movement averages, and trend analysis |
Understanding Fundamental Analysis vs. Technical Analysis

Fundamental Analysis:
Fundamental analysis evaluates a security’s intrinsic value by examining related economic, financial, and qualitative factors that could influence its future performance. It focuses on understanding the underlying business, its financial health, management quality, industry position, and economic conditions.
Key Components of Fundamental Analysis:

- Financial Statements: Analyzing income statements, balance sheets, and cash flow statements to assess profitability, liquidity, and financial stability.
- Economic Indicators: Considering macroeconomic factors such as GDP growth, interest rates, inflation, and industry-specific trends.
- Qualitative Factors: Evaluating management expertise, competitive advantages, market position, and corporate governance.
Example of Fundamental Analysis:

Suppose you’re evaluating Company A, a leading pharmaceutical firm. You analyze its recent financial statements, noting strong revenue growth and increasing profit margins. Additionally, the company has a robust pipeline of new drugs and a reputation for innovation in the industry. Based on this fundamental analysis, you conclude that Company A is undervalued relative to its growth prospects, making it an attractive investment opportunity.
Technical Analysis:

Technical analysis focuses on studying past market data, primarily price and volume, to forecast future price movements. It utilizes charts, patterns, and statistical indicators to identify trends and potential trading opportunities. Technical analysts believe that historical price patterns repeat and can provide insights into future market behavior.
Key Components of Technical Analysis:

- Price Charts: Using various chart types (e.g., line charts, candlestick charts) to visualize price movements over different time frames.
- Technical Indicators: Applying tools like moving averages, RSI (Relative Strength Index), MACD (Moving Average Convergence Divergence), and Bollinger Bands to spot trends and signals.
- Volume Analysis: Examining trading volumes to gauge market participation and confirm price trends.
Example of Technical Analysis:

Consider Stock B, which has shown a consistent pattern of higher highs and higher lows over the past six months. A technical analyst observes that the stock recently bounced off its 50-day moving average with increasing trading volume, suggesting strong buying interest. Based on this technical analysis, the analyst predicts that Stock B is likely to continue its upward trend in the short term.
Key Differences:

- Approach: Fundamental analysis evaluates intrinsic value and long-term potential based on business fundamentals and economic factors. Technical analysis focuses on price patterns and historical data to forecast short-term price movements.
- Time Horizon: Fundamental analysis is typically used for long-term investing, while technical analysis is more commonly applied for short-term trading.
- Data Used: Fundamental analysis uses financial statements, economic data, and qualitative factors. Technical analysis relies on historical price and volume data, charts, and technical indicators.
The Bottom Line:
Both fundamental and technical analysis are valuable tools used by investors and traders to make informed decisions in the financial markets. Fundamental analysis provides a deep understanding of a company’s underlying value and growth prospects, while technical analysis helps identify short-term trading opportunities based on price trends and patterns. By understanding the differences and strengths of each approach, investors can effectively integrate both methodologies into their investment strategies to achieve their financial goals.
